In the sophisticated landscape of immunology, macrophages represent the frontline of innate immunity and the architects of tissue homeostasis. These cells are defined by their remarkable plasticity—the ability to change their functional phenotype in response to environmental stimuli. This process, known as macrophage polarization, typically results in two extremes: the pro-inflammatory M1 (classically activated) phenotype and the anti-inflammatory M2 (alternatively activated) phenotype.
Understanding how to induce these specific states in a laboratory setting is foundational for research into infectious diseases, oncology, and regenerative medicine. This article provides an educational, step-by-step deep dive into the procedure for differentiating peripheral blood-derived monocytes into highly polarized M1 and M2 macrophages.
The Biological Significance of Polarization
Macrophages originate from monocytes circulating in the blood. Upon migrating into tissues, they encounter various “cues” such as cytokines and microbial products. These cues dictate their maturation path.
The M1 Phenotype: The Defender
M1 macrophages are the “first responders” to infection. Stimulated by Granulocyte-Macrophage Colony-Stimulating Factor (GM-CSF), Interferon-gamma (IFN-$\gamma$), and Lipopolysaccharide (LPS), they produce high levels of reactive oxygen species (ROS) and pro-inflammatory cytokines. Their primary role is to kill pathogens and prime the adaptive immune response.
The M2 Phenotype: The Healer
Conversely, M2 macrophages are induced by Macrophage Colony-Stimulating Factor (M-CSF) and Interleukin-4 (IL-4). They are characterized by their ability to dampen inflammation, promote tissue repair, and clear debris. However, in the context of cancer, “Tumor-Associated Macrophages” (TAMs) often adopt an M2-like state, which can unfortunately shield tumors from the immune system.
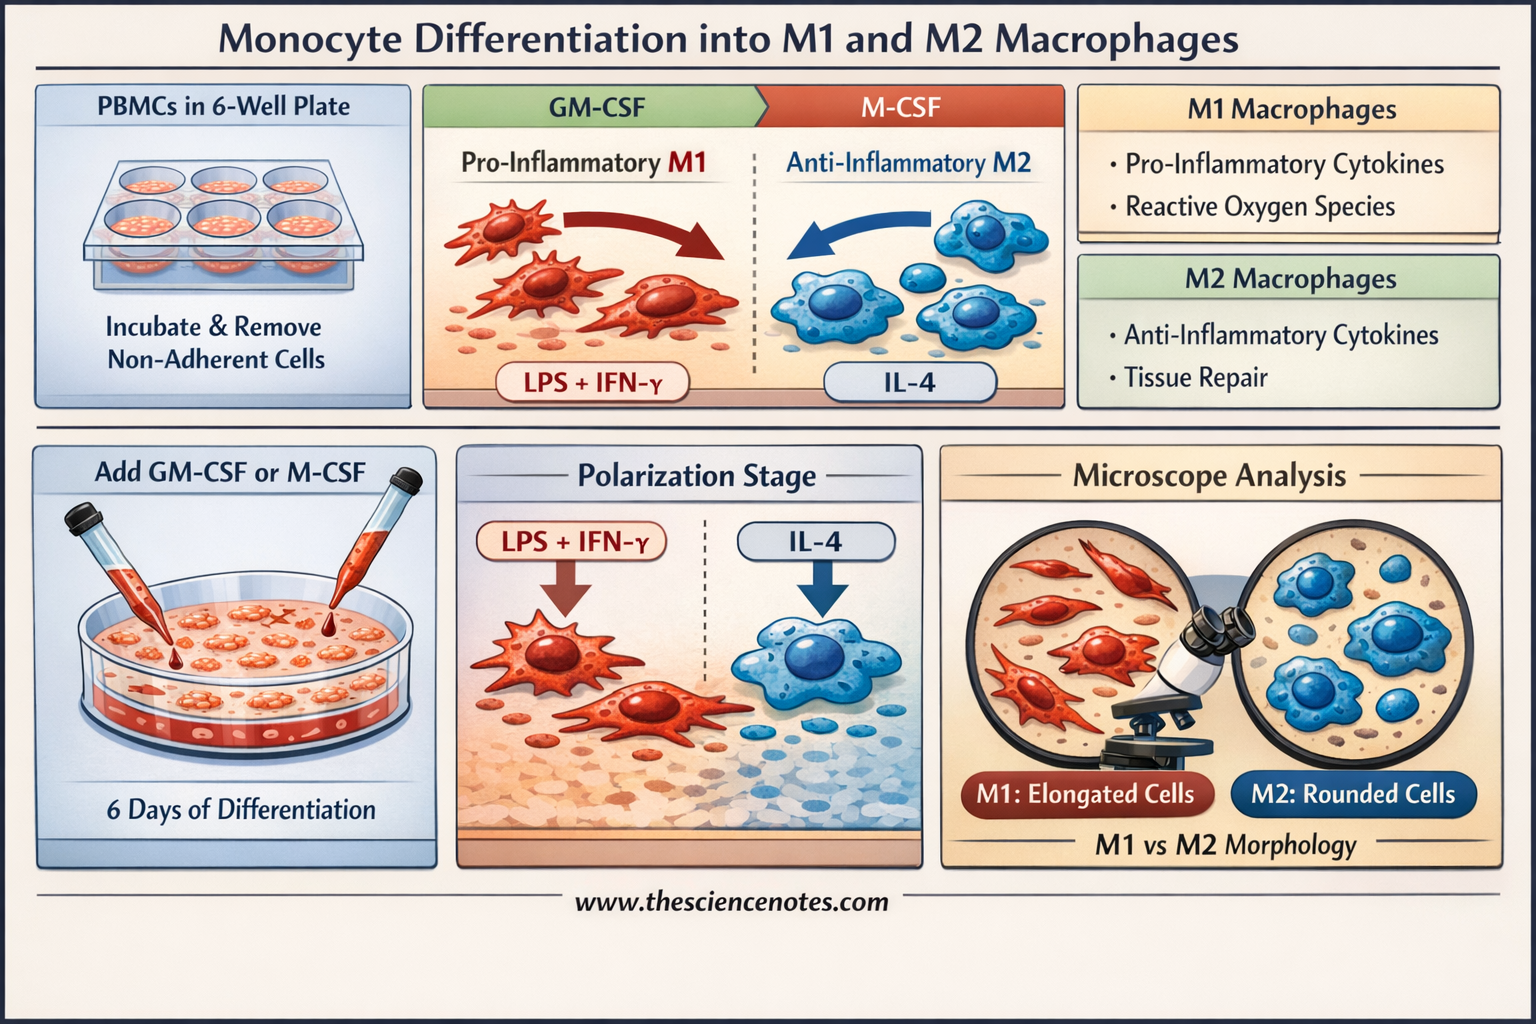
Image creator: www.thesciencenotes.com
Detailed Laboratory Protocol – Macrophage polarization
All procedures involving human participants must be performed in compliance with the institutional, national, and international guidelines for human welfare and must be reviewed by the local Institutional Review Board (IRB).
Phase 1: Monocyte Isolation via Plastic Adherence (Day 0)
The purity of your starting monocyte population is critical. We utilize the selective adherence property of monocytes to separate them from other Peripheral Blood Mononuclear Cells (PBMCs).
Preparation: Dilute freshly isolated PBMCs to a concentration of $5 \times 10^6$ cells/mL in serum-free RPMI 1640 medium (supplemented with 1 mM sodium pyruvate, 2 mM L-glutamine, and 10 mM HEPES).
Seeding: Seed 2 mL of the cell suspension (total $10 \times 10^6$ PBMCs) into individual wells of a 6-well plastic culture plate.
Adhesion: Incubate the plate at 37 °C and 5% $CO_2$ for 2 to 3 hours. During this time, monocytes will adhere to the plastic surface.
Washing: Remove the supernatant containing non-adherent cells (T-cells, B-cells, NK cells). Wash the wells three times with 1 mL of serum-free medium per wash. The remaining cells are monocytes, typically representing 10% of the initial PBMC load.
Phase 2: Differentiation (Days 1–5)
Now that the monocytes are isolated, they must be “primed” to become macrophages.
Growth Factor Addition: Add 2 mL of complete RPMI medium (supplemented with 10% heat-inactivated FBS) containing either:
50 ng/mL GM-CSF (for M1 differentiation).
50 ng/mL M-CSF (for M2 differentiation).
Medium Refresh (Day 3): Carefully remove 1 mL of the supernatant from the top layer. Replace it with 1 mL of fresh complete medium containing a 100 ng/mL concentration of the growth factor. This ensures the final concentration in the well remains at 50 ng/mL.
Phase 3: Final Polarization (Day 6)
On the sixth day, the macrophages are fully matured but need a final “push” to reach their polarized states.
For M1 Polarization: Add IFN-$\gamma$ and LPS to the GM-CSF wells to reach final concentrations of 50 ng/mL IFN-$\gamma$ and 10 ng/mL LPS. Incubate for the last 18–20 hours.
For M2 Polarization: Add IL-4 to the M-CSF wells to reach a final concentration of 20 ng/mL IL-4. Incubate for 18–20 hours.
For M0 Macrophages: Continue with M-CSF only. This provides a baseline, “unactivated” macrophage phenotype (often showing an M2-like lean).
Differentiating M1 vs. M2: Markers and Expression
To confirm successful polarization, researchers use a combination of morphological assessment, surface marker analysis (via Flow Cytometry), and cytokine profiling (via ELISA or qPCR).
1. Morphological Characteristics
Under a light microscope, the two phenotypes exhibit distinct shapes:
M1 Macrophages: Appear elongated and stretched, sometimes described as “spindle-like.”
M2 Macrophages: Generally exhibit a rounded, “fried-egg” morphology.
2. Surface Markers and Protein Expression – Macrophage polarization
Surface markers are the gold standard for identifying macrophage subsets. M1 cells express markers associated with antigen presentation and co-stimulation, while M2 cells express scavenger receptors.
| Category | M1 (Pro-inflammatory) | M2 (Anti-inflammatory) |
| Surface Markers | CD80, CD86, CD11c, MHCII | CD163, CD206 (Mannose Receptor), CD209 |
| Cytokine Secretion | IL-12, IL-1$\beta$, TNF-$\alpha$, IL-6 | IL-10, TGF-$\beta$, IL-1ra |
| Chemokines | CXCL9, CXCL10, CXCL11 | CCL17, CCL18, CCL22 |
| Enzyme Expression | iNOS (Inducible Nitric Oxide Synthase) | Arginase-1 (Arg-1) |
| Metabolism | Glycolysis-driven | Oxidative Phosphorylation (OXPHOS) |
3. M2 Subclasses
While M1 is relatively uniform, the M2 phenotype is subdivided based on the stimuli used:
M2a: Induced by IL-4 or IL-13 (involved in wound healing).
M2b: Induced by immune complexes and LPS (regulatory role).
M2c: Induced by IL-10 or glucocorticoids (immunosuppression and matrix remodeling).
M2d: Induced by TLR ligands and Adenosine (Tumor-Associated Macrophages).
Metabolic and Enzymatic Distinction
A key educational point in macrophage biology is the Arginine Metabolism Switch.
M1 macrophages use iNOS to convert L-arginine into Nitric Oxide (NO) and L-citrulline. NO is a potent antimicrobial agent.
M2 macrophages use Arginase-1 to convert L-arginine into L-ornithine and urea, which are precursors for collagen synthesis and tissue repair.
This metabolic divergence is one of the most reliable ways to distinguish the two populations in a laboratory setting.
Conclusion and Best Practices
Successful macrophage polarization requires strict adherence to timing and cytokine concentrations. The transition from a small, circular monocyte to a large, complex macrophage is a visual testament to the power of cellular differentiation. By utilizing the GM-CSF/M-CSF priming method followed by secondary activation, researchers can create a robust in vitro model for human immunity.
Key Takeaways for the Lab:
Always use heat-inactivated FBS to avoid spontaneous activation by complement proteins.
Ensure consistent plasticware; different brands may affect monocyte adherence levels.
Monitor morphology daily; sudden changes in shape before Day 6 may indicate contamination or unintended activation.