Ultraviolet–visible (UV-Vis) spectroscopy is one of the most widely used analytical techniques in chemistry, biology, and environmental sciences. Its popularity comes from its versatility, simplicity, and broad applicability, as it can detect nearly every molecule under the right conditions. From identifying compounds to measuring DNA, proteins, and reaction kinetics, UV-Vis spectroscopy is a foundational tool in student laboratories and research facilities alike.
This student-friendly, SEO-optimized guide explains how UV-Vis spectroscopy works, its underlying principles, instrumentation, experimental procedure, and real-world applications.
What Is UV-Vis Spectroscopy?
UV-Vis spectroscopy measures how much ultraviolet (UV) or visible light a sample absorbs. When UV-Vis light passes through a sample, some wavelengths are absorbed while others are transmitted. The amount of transmitted light is measured as transmittance (T), and absorbance (A) is calculated using the equation:
A=−log(T)A = -\log(T)
By plotting absorbance against wavelength, an absorbance spectrum is obtained. Each compound produces a unique absorbance spectrum based on its chemical structure, making UV-Vis spectroscopy useful for both qualitative and quantitative analysis.
Why Is UV-Vis Spectroscopy Important?
UV-Vis spectroscopy is widely used because it can:
Identify compounds and functional groups
Measure concentration using Beer’s Law
Quantify DNA, RNA, and proteins
Monitor reaction kinetics over time
Serve as a detector in chromatography techniques
Analyze water quality and environmental samples
Although UV-Vis is not the most sensitive spectroscopic method, it remains a general-purpose analytical tool with broad applicability.
Principles of UV-Vis Spectroscopy

UV and Visible Light Regions
Ultraviolet (UV): 100–400 nm
Visible light: 400–700 nm
Deep UV: 100–200 nm (rarely used due to limited light sources)
Most UV-Vis spectrometers operate between 200–800 nm.
Photon Absorption and Electronic Transitions
When a photon strikes a molecule and is absorbed, an electron is promoted from a lower energy state (ground state) to a higher energy excited state. In UV-Vis spectroscopy, this involves transitions between molecular orbitals:
HOMO: Highest Occupied Molecular Orbital
LUMO: Lowest Unoccupied Molecular Orbital
The energy difference between HOMO and LUMO is called the band gap. A photon is absorbed only if its energy exactly matches this gap.
Common UV-Vis Electronic Transitions
π → π* (double bonds; strong absorption)
n → π* (non-bonding electrons)
σ → σ* (single bonds; deep UV, less useful)
Molecules with double bonds and conjugation absorb strongly in the UV-Vis range. Increased conjugation generally leads to greater absorbance and longer wavelengths.
Why Are UV-Vis Peaks Broad?
UV-Vis spectra often show broad peaks or shoulders due to overlapping vibrational and rotational energy levels, resulting in slightly different absorption energies.
Color and UV-Vis Absorption
A common misconception is that a compound absorbs the color it appears. In reality:
A compound appears colored because it transmits that color
It absorbs light of the complementary color
The wavelength of maximum absorbance (λmax) corresponds to the complementary color
For example:
A blue dye absorbs in the orange/red region
A red dye absorbs in the green region
A color wheel is often used to predict absorbance behavior.
Beer’s Law and Quantitative Analysis
Absorption follows Beer’s Law:
A=εbCA = \varepsilon b C
Where:
A = absorbance
ε = molar attenuation coefficient
b = path length (usually 1 cm)
C = concentration
The molar attenuation coefficient is a property of the molecule and depends on functional groups and conjugation. If absorbance is low, molecules can sometimes be chemically tagged to enhance detection.
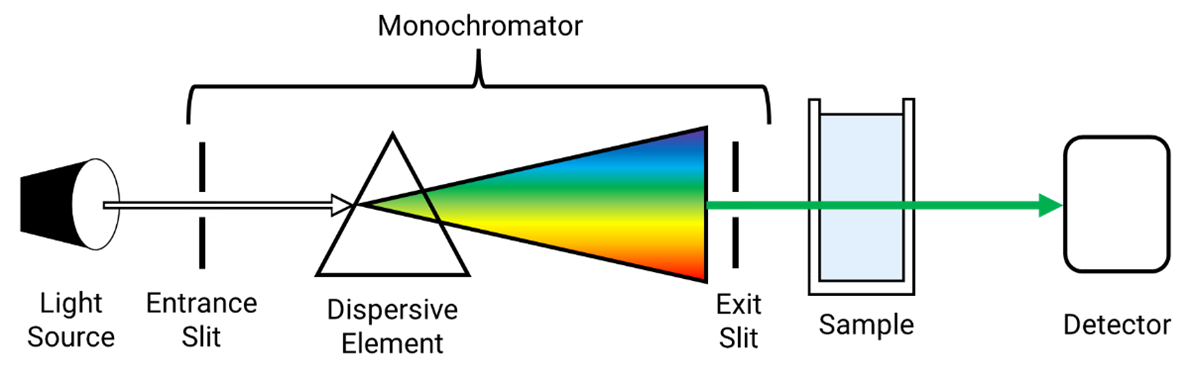
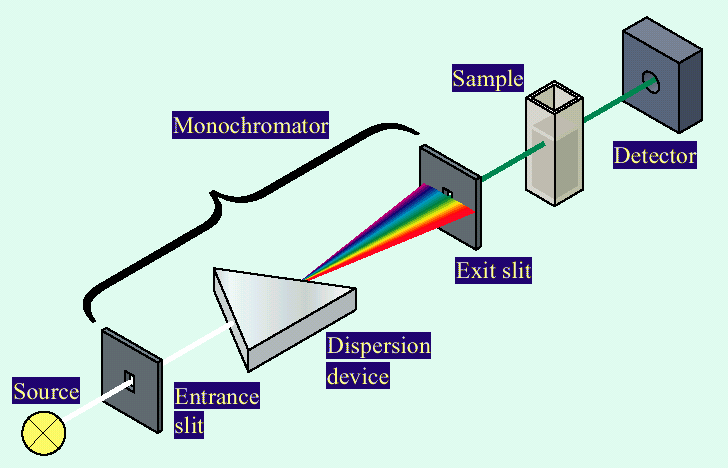
UV-Vis Instrumentation
Deuterium lamp: UV region (170–375 nm)
Tungsten filament lamp: Visible region (350–2,500 nm)
Wavelength Selection
Filters: simple wavelength selection
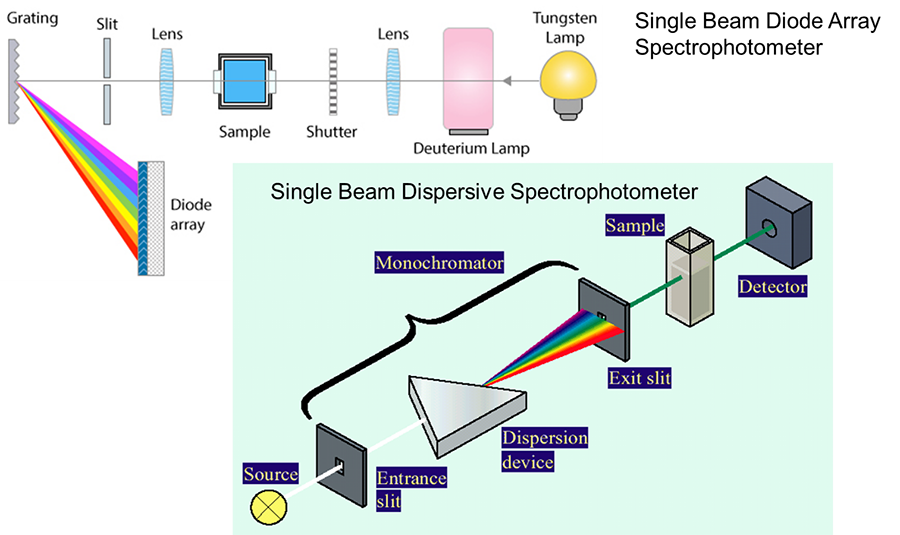
Monochromators: spatially separate wavelengths and scan spectra
Diode-array detectors: capture full spectra simultaneously
Diode-array instruments are faster but more complex and expensive.
UV-Vis Experimental Procedure
1. Calibrate the Spectrometer
Turn on the instrument and allow lamps to warm up (~20 minutes)
Fill a cuvette with solvent (blank)
Clean the cuvette exterior
Measure the blank to correct for solvent absorption
2. Collect an Absorbance Spectrum
Rinse cuvette with sample and fill ~¾ full
Insert cuvette correctly and block ambient light
Scan from 200–800 nm
Determine λmax
Repeat scans to estimate error
To build a calibration curve, measure spectra at different concentrations. Absorbance values above 1.5 should be avoided—dilute samples if necessary.
3. Reaction Kinetics Using UV-Vis
UV-Vis is ideal for studying reaction rates:
Record initial absorbance
Add reagent to initiate reaction
Measure absorbance at λmax over time
Convert absorbance to concentration using Beer’s Law
Determine reaction order and rate constants
Results and Interpretation


Blue dyes absorb in the orange/red region
Red dyes absorb in the green region
Kinetics plots often show exponential decay, indicating first-order reactions
Applications of UV-Vis Spectroscopy
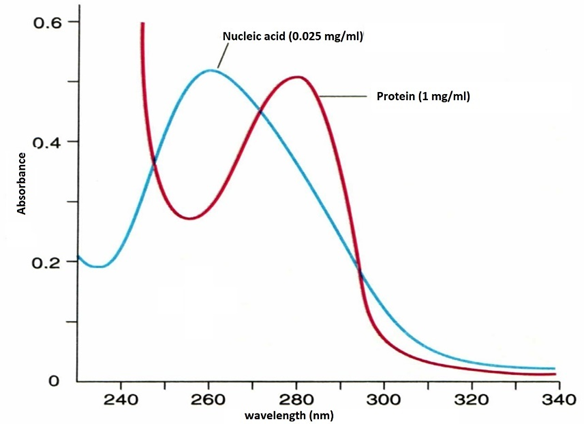


Proteins: absorb strongly at 280 nm
DNA/RNA: absorb at 260 nm
Purity assessment: A260/A280 ratio
Chemical and Analytical Applications
Compound identification
Concentration determination
Water and environmental analysis
Chromatography detection
Multi-component analysis with diode-array detectors
Advantages and Limitations of UV-Vis Spectroscopy
Advantages
Simple and fast
Non-destructive
Applicable to many compounds
Ideal for teaching laboratories
Limitations
Lower sensitivity than fluorescence
Limited selectivity
Requires UV-absorbing chromophores
Conclusion
UV-Vis spectroscopy is a fundamental analytical technique that plays a critical role in chemistry, biology, and environmental science. By measuring light absorption and applying Beer’s Law, students can identify compounds, determine concentrations, and study reaction kinetics. While not the most sensitive technique, UV-Vis remains one of the most versatile and widely used tools in the laboratory.
Understanding UV-Vis spectroscopy provides a strong foundation for more advanced analytical methods and real-world scientific applications.