RNA sequencing, commonly called RNA-seq, is a high-throughput sequencing method used to study the transcriptome. The transcriptome includes the RNA molecules expressed in a cell, tissue, organism, or biological condition. Unlike DNA sequencing, which examines relatively stable genomic information, RNA-seq captures a dynamic molecular snapshot. It shows which genes are active, how strongly they are expressed, and which transcript isoforms appear under specific conditions.
Researchers use RNA-seq to measure gene expression, discover novel transcripts, identify alternative splicing events, detect fusion transcripts, study non-coding RNAs, and compare biological states. RNA-seq combines transcript discovery and quantification in one assay, which explains why it has become a standard method across molecular biology, developmental biology, cancer genomics, microbiology, immunology, neuroscience, and systems biology (Conesa et al., 2016).
RNA-seq differs from older expression-profiling methods such as microarrays. Microarrays depend on predesigned probes, so they mainly detect known sequences. RNA-seq can detect known and novel RNA molecules, quantify a broader expression range, and support studies in organisms with incomplete or absent reference genomes (Huang et al., 2015).
What Is RNA-Seq?
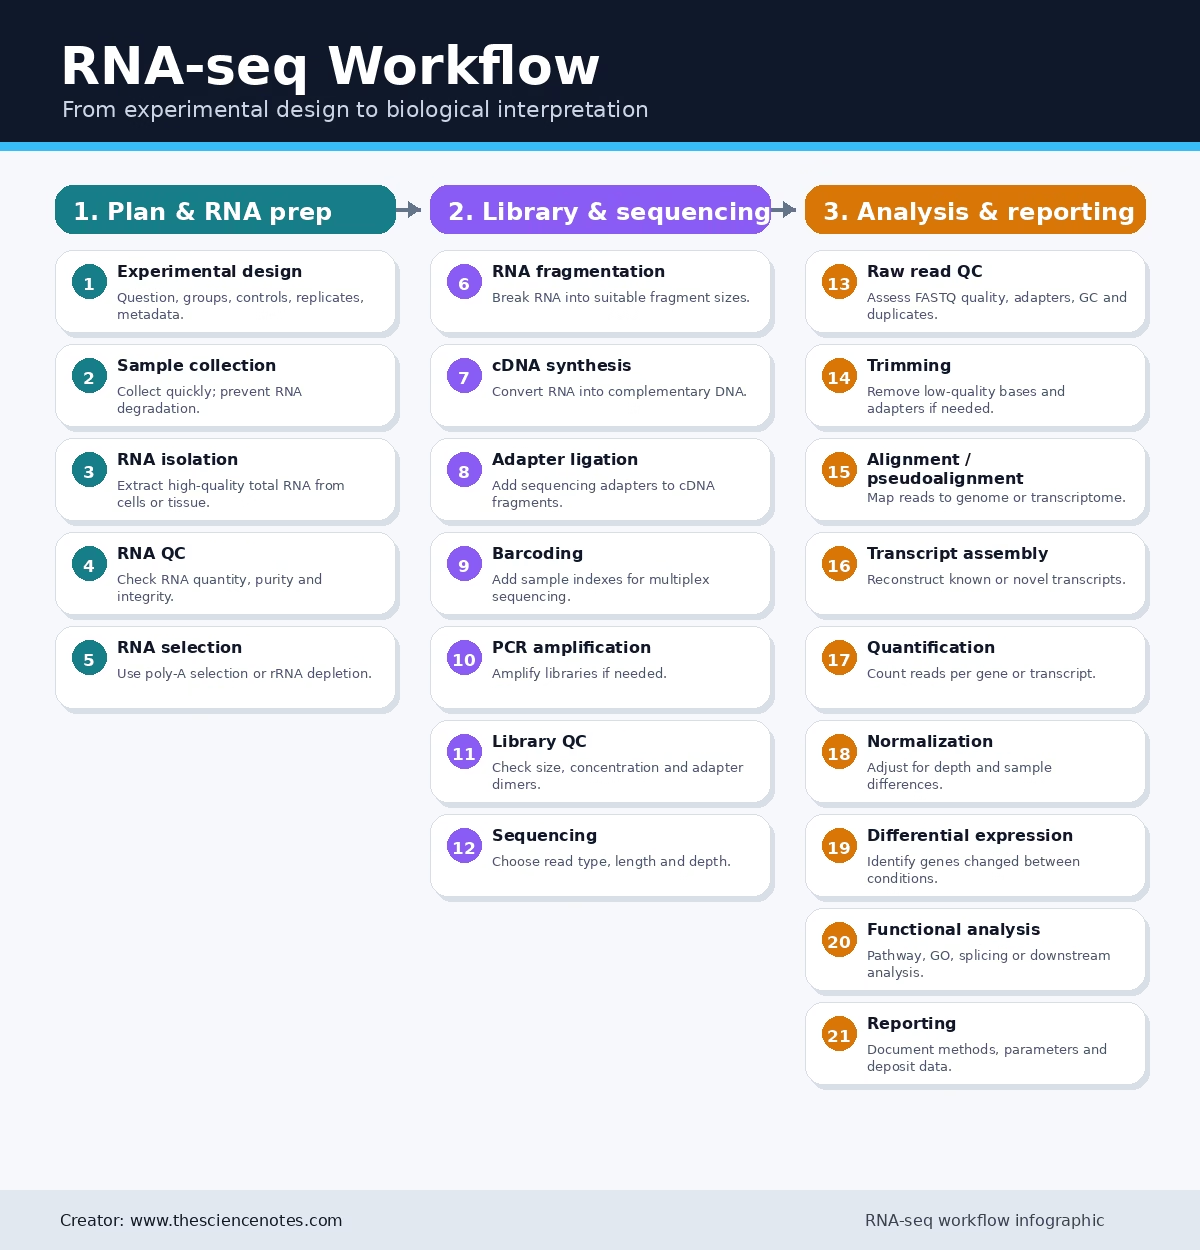
RNA-seq is a sequencing-based method that converts RNA molecules into a sequencing-ready DNA library. Researchers first isolate RNA from the sample of interest. They then enrich the RNA fraction they want to study, convert RNA into complementary DNA, add sequencing adapters, amplify or otherwise prepare the library, and sequence the resulting fragments.
The output consists of millions to billions of sequence reads. Bioinformatics tools then process these reads. Depending on the analysis plan, reads may align to a reference genome, map to a reference transcriptome, assemble into transcripts, or quantify known genes and isoforms (Pertea et al., 2016).
RNA-seq can answer several research questions:
- Which genes are expressed?
- Which transcripts or isoforms are present?
- How much RNA comes from each gene or transcript?
- Which genes differ between conditions?
- Are novel splice junctions, fusion transcripts, or non-coding RNAs present?
- Which pathways or regulatory programs change across samples?
These features make RNA-seq both a discovery tool and a quantitative assay.
Why RNA-Seq Is Important
RNA-seq has reshaped transcriptomics because it can measure many transcripts at once with high sensitivity. It also allows researchers to examine expression patterns without limiting the experiment to previously annotated genes.
This flexibility matters in many research settings. In cancer biology, RNA-seq can reveal oncogenic expression programs, fusion transcripts, isoform switching, immune infiltration patterns, and therapeutic resistance signatures. evelopmental biology, it can track gene expression across time points or cell states. In microbiology, it can show how pathogens respond to stress, antibiotics, or host environments.
RNA-seq also supports systems-level research. Researchers can combine it with ATAC-seq, ChIP-seq, DNA methylation profiling, proteomics, metabolomics, or single-cell methods to build regulatory models. Best-practice reviews emphasize that no single RNA-seq pipeline fits every biological question, because experimental design and analysis choices depend on the organism, sample type, RNA species, and research goal (Conesa et al., 2016).
RNA-Seq Compared With Microarrays
Microarrays measure RNA abundance by hybridizing labeled nucleic acids to fixed probes. This design works well when the target transcriptome is already well annotated. It becomes less useful when researchers want to discover new transcripts, study unannotated organisms, or analyze complex isoforms.
RNA-seq does not require predesigned probes. It directly sequences fragments from expressed RNA molecules. This gives researchers a better chance to detect novel transcripts, alternative splice forms, allele-specific expression, non-coding RNAs, and transcript boundaries.
RNA-seq also offers a wider dynamic range than microarrays. Microarrays can suffer from background noise at low expression levels and signal saturation at high expression levels. RNA-seq relies on read counts, so it can better represent very low and very high expression values when the experiment has adequate depth and quality (Huang et al., 2015).
Core Principle of RNA-Seq
The central principle of RNA-seq is simple: RNA abundance influences sequencing read abundance. If a transcript appears frequently in the original sample, sequencing should produce more reads from that transcript. If a transcript appears rarely, sequencing should produce fewer reads.
This relationship is not perfect. Library preparation, RNA degradation, fragment length, GC content, PCR amplification, mapping ambiguity, transcript length, and batch effects can distort read counts. For this reason, RNA-seq requires strong experimental design, careful quality control, appropriate normalization, and statistically valid differential expression analysis (Conesa et al., 2016).
Researchers should treat RNA-seq as a quantitative experiment, not just a sequencing run. The quality of the biological design often matters more than the sequencing technology alone.
RNA Species Measured by RNA-Seq
RNA-seq can target different RNA populations. The choice depends on the biological question.
Messenger RNA
Messenger RNA, or mRNA, carries protein-coding information. Most eukaryotic mRNAs contain a poly-A tail. Researchers can enrich these transcripts by using oligo-dT probes that bind the poly-A tail.
Poly-A selection works well for high-quality eukaryotic RNA. It enriches protein-coding transcripts and many polyadenylated long non-coding RNAs. It does not capture most non-polyadenylated RNAs, fragmented RNA, or many bacterial transcripts (Wang et al., 2009).
Total RNA
Total RNA sequencing starts from a broader RNA pool. Because ribosomal RNA dominates total RNA, researchers usually remove rRNA before sequencing. Total RNA-seq can capture coding and non-coding RNAs, including partially degraded transcripts and non-polyadenylated RNAs.
This approach often works better for bacteria, archived tissue, formalin-fixed paraffin-embedded samples, and studies focused on long non-coding RNA or pre-mRNA (Wang et al., 2009; Baldwin et al., 2021).
Small RNA
Small RNA-seq targets short regulatory RNA molecules. These include microRNAs, siRNAs, piRNAs, and other small RNA species. Small RNA libraries require size selection and specialized adapter strategies. Standard RNA-seq pipelines do not directly apply to small RNA-seq because read lengths, adapter trimming, mapping behavior, and annotation workflows differ (Conesa et al., 2016).
Step 1: Experimental Design
A strong RNA-seq study starts before RNA extraction. Researchers need a clear biological question, a defined contrast, sufficient biological replication, and a plan for controlling technical variation.
Common comparisons include treated versus untreated samples, disease versus control tissue, wild type versus mutant cells, time-course stages, cell-type differences, or environmental conditions. The design should account for covariates such as sex, age, batch, donor, tissue region, treatment time, library preparation date, and sequencing lane.
Biological replicates matter because RNA-seq differential expression relies on estimating variability. Protocols for transcript-level RNA-seq analysis often treat three biological replicates per condition as a minimum for statistical testing, while larger sample sizes improve power and dispersion estimation (Pertea et al., 2016).
Researchers should randomize samples across extraction batches, library batches, and sequencing lanes when possible. They should also record metadata in a structured format. Poor metadata limits interpretation even when sequencing data look technically sound.
Step 2: RNA Isolation
RNA isolation must preserve the expression profile present at the moment of sampling. RNA degrades easily because RNases are common and stable. Sample collection, stabilization, storage, extraction chemistry, and freeze-thaw history can all affect RNA quality.
Researchers often isolate total RNA using silica columns, phenol-chloroform extraction, magnetic beads, or automated systems. The best method depends on sample type. Fresh cultured cells, blood, plant tissue, bacteria, laser-captured tissue, and FFPE tissue each require different handling.
Clinical samples need special attention. RNA from archived or FFPE material often shows fragmentation, chemical modification, and cross-linking. Recent FFPE-focused work shows that library preparation strategy can strongly affect gene expression profiling from degraded clinical tissue (Pignatta et al., 2025; Song et al., 2023).
Step 3: RNA Quality Control
RNA quality control is essential. Degraded RNA can bias coverage, reduce transcript detection, distort differential expression, and increase false discoveries.
Researchers commonly assess RNA quantity with fluorometric methods and RNA integrity with microfluidic electrophoresis. The RNA Integrity Number, or RIN, provides a standardized score from 1 to 10, where higher values indicate more intact RNA. The RIN method uses electropherogram features from instruments such as the Agilent Bioanalyzer (Schroeder et al., 2006).
For many standard bulk RNA-seq studies, researchers prefer high RIN values. However, RIN has limits. It mainly reflects ribosomal RNA integrity and may not fully represent mRNA integrity. In degraded clinical samples, metrics such as DV200 or transcript integrity estimates may give additional information (Wang et al., 2016).
RNA quality should also influence library strategy. Poly-A selection usually performs best with intact RNA. rRNA depletion often works better for degraded samples, non-polyadenylated RNA, and bacterial RNA.
Step 4: rRNA Depletion or Poly-A Selection
Most cellular RNA is ribosomal RNA. In standard transcriptome studies, rRNA consumes sequencing capacity without answering most gene expression questions. A best-practice RNA-seq review notes that rRNA can constitute more than 90% of total RNA, while mRNA may represent only 1–2% of the pool (Conesa et al., 2016).
Researchers use two major enrichment strategies.
Poly-A Selection
Poly-A selection uses oligo-dT probes attached to beads. These probes bind polyadenylated RNA. The method enriches mRNA in eukaryotic samples and reduces rRNA contamination.
Poly-A selection offers clean mRNA libraries and strong exon enrichment. It can miss non-polyadenylated transcripts and performs poorly when RNA is heavily degraded (Wang et al., 2009).
rRNA Depletion
rRNA depletion removes ribosomal RNA using sequence-specific probes, RNase H digestion, capture beads, or related approaches. It allows researchers to sequence both polyadenylated and non-polyadenylated transcripts.
This approach works well for bacteria, FFPE tissue, partially degraded RNA, and non-coding RNA studies. It may produce more intronic or intergenic reads than poly-A selection. Researchers should choose it when transcript breadth matters more than strict mRNA enrichment (Wang et al., 2009; Baldwin et al., 2021).
Step 5: RNA Fragmentation
Many short-read RNA-seq workflows fragment RNA or cDNA before sequencing. Fragmentation creates molecules within a size range that the sequencing platform can handle.
Typical short-read libraries often contain inserts of a few hundred nucleotides. Fragmentation helps reduce length bias because long transcripts otherwise produce more sequenceable material than short transcripts.
Researchers must tune fragmentation conditions. Over-fragmentation can reduce mappability and isoform information. Under-fragmentation can create poor cluster formation or inefficient sequencing. Insert size also matters for paired-end sequencing, isoform analysis, and structural transcript discovery (Jaksik et al., 2021).
Step 6: cDNA Synthesis
Most sequencing instruments sequence DNA rather than RNA. Therefore, standard RNA-seq converts RNA into complementary DNA, or cDNA. Reverse transcriptase synthesizes the first cDNA strand. A second-strand synthesis step then creates double-stranded cDNA.
This step can introduce bias. Reverse transcription efficiency varies by RNA structure, GC content, primer strategy, and transcript length. Random hexamer priming can provide broad coverage but may generate sequence bias. Oligo-dT priming enriches 3′ ends and may increase 3′ bias in degraded samples.
Researchers should select protocols that match the goal. Full-length transcript discovery, 3′ tag counting, low-input sequencing, degraded RNA, and total RNA-seq each require different cDNA strategies.
Step 7: Adapter Ligation and Barcoding
Sequencing adapters are short oligonucleotide sequences added to library fragments. They provide priming sites for amplification and sequencing. They also allow fragments to bind to the flow cell or sequencing surface.
Most modern libraries include sample indexes, also called barcodes. Barcodes allow researchers to pool multiple samples in one sequencing run. After sequencing, software separates reads by barcode in a process called demultiplexing.
Researchers should balance barcode design. Poor barcode diversity can reduce demultiplexing quality. Index hopping or barcode misassignment can also affect low-input and highly multiplexed experiments. Good experimental design avoids placing all samples from one biological condition in one sequencing lane.
Step 8: PCR Amplification and Library QC
Many RNA-seq protocols amplify the library by PCR. PCR increases library quantity, but too many cycles can increase duplicates, skew abundance estimates, and enrich biased fragments.
Library QC usually includes fragment-size assessment and library quantification. A Bioanalyzer, TapeStation, or Fragment Analyzer can show whether the library has the expected size distribution. qPCR or fluorometric assays can estimate library concentration.
Researchers should check for adapter dimers, broad size distributions, low yield, and unexpected peaks. Library QC problems often predict sequencing problems. They may also explain downstream bias or poor mapping.
Step 9: Sequencing Strategy
RNA-seq sequencing design depends on the question.
Single-End Reads
Single-end sequencing reads one end of each fragment. It costs less and works well for simple gene-level expression analysis in well-annotated organisms.
Paired-End Reads
Paired-end sequencing reads both ends of each fragment. It improves mapping, helps resolve isoforms, supports fusion detection, and provides insert-size information. Researchers often prefer paired-end reads for transcript assembly, alternative splicing, and poorly annotated transcriptomes (Conesa et al., 2016).
Read Length
Short reads can quantify genes well, especially in model organisms. Longer reads improve splice-junction detection, transcript reconstruction, and isoform resolution. Long-read platforms can sequence full-length transcripts and reduce the need to infer isoforms from short fragments (Conesa et al., 2016).
Sequencing Depth
Depth should match the biological aim. Gene-level differential expression often needs fewer reads than isoform discovery, allele-specific expression, fusion detection, or low-abundance transcript detection. Best-practice reviews note that optimal sequencing depth varies widely by objective, sample complexity, and transcript abundance (Conesa et al., 2016).
Step 10: Raw Read Quality Control
After sequencing, researchers inspect FASTQ files. Raw-read QC examines base quality, adapter contamination, GC distribution, sequence duplication, overrepresented sequences, and read length.
Quality usually declines toward the 3′ end of reads. If needed, researchers trim low-quality bases and adapters before alignment or quantification. However, excessive trimming can reduce mappability. Researchers should document trimming rules and keep them consistent across samples.
Best-practice RNA-seq workflows recommend QC at multiple stages, including raw reads, read alignment, and expression quantification (Conesa et al., 2016).
Step 11: Alignment or Pseudoalignment
Researchers typically choose between alignment-based and lightweight mapping approaches.
Genome Alignment
Genome alignment maps reads to a reference genome. RNA-seq aligners must handle splice junctions because mature RNA lacks introns. A read may span two exons separated by a long intron in the genome.
STAR is a widely used spliced aligner. It was developed to map large RNA-seq datasets quickly and can detect canonical splice junctions, non-canonical splices, chimeric transcripts, and full-length RNA sequences (Dobin et al., 2013).
HISAT and HISAT2 also support efficient spliced alignment. The HISAT/StringTie/Ballgown workflow aligns reads, assembles transcripts, estimates abundance, and tests differential expression (Pertea et al., 2016).
Transcriptome Mapping and Pseudoalignment
If researchers only need known transcript quantification, they can map or pseudoalign reads to a transcriptome. Tools such as Salmon and kallisto avoid full genome alignment and can quantify transcript abundance quickly.
Salmon uses lightweight mapping and bias models. It can correct sequence-specific, positional, and fragment GC-content biases, which can improve transcript abundance estimates and downstream differential expression analysis (Patro et al., 2017).
Step 12: Transcript Assembly
Transcript assembly reconstructs expressed transcripts from aligned reads. It helps identify known and novel isoforms.
This task becomes difficult when genes contain many exons, overlapping isoforms, repeated regions, or lowly expressed transcripts. Short reads may not span enough splice junctions to reconstruct full-length isoforms with certainty.
StringTie can assemble transcripts from genome alignments, estimate expression, and merge assemblies across samples. The HISAT/StringTie/Ballgown protocol uses this approach to build consistent transcript models before differential expression analysis (Pertea et al., 2016).
For organisms without reference genomes, researchers can perform de novo transcriptome assembly. Tools such as Trinity and related assemblers reconstruct transcript contigs directly from reads. De novo analysis requires careful validation because fragmented assemblies and redundant contigs can complicate quantification and annotation (Conesa et al., 2016).
Step 13: Gene and Transcript Quantification
Quantification estimates how much RNA comes from each gene or transcript.
At the gene level, researchers can count reads overlapping annotated features. Tools such as featureCounts and HTSeq-count use genome annotations to assign reads to genes.
At the transcript level, quantification becomes harder. Many isoforms share exons. A read may match several transcript isoforms from the same gene. Probabilistic methods allocate ambiguous reads across transcripts.
Raw counts are not directly comparable across samples without normalization. Counts depend on sequencing depth, transcript length, RNA composition, GC bias, and other technical factors. RNA-seq reviews therefore recommend normalization before cross-sample comparison or statistical testing (Conesa et al., 2016).
Researchers often use counts for differential expression and TPM for within-sample transcript abundance summaries. They should avoid treating TPM values as direct substitutes for count-based models in standard differential expression workflows.
Step 14: Normalization
Normalization adjusts RNA-seq data so samples become comparable. Without it, a sample with more reads may appear to express every gene at a higher level.
Common normalization approaches include size-factor normalization, trimmed mean of M-values, upper-quartile normalization, and methods that adjust for gene length or GC content. The correct approach depends on the analysis.
Differential expression tools such as DESeq2 and edgeR model count data and estimate sample-specific normalization factors. DESeq2 uses shrinkage estimation for dispersions and fold changes, which improves stability and interpretability when datasets have small replicate numbers, large dynamic range, discreteness, and outliers (Love et al., 2014).
Researchers should inspect normalization results. PCA plots, sample distance heatmaps, density plots, and relative log expression plots can reveal batch effects, outliers, or failed samples.
Step 15: Differential Expression Analysis
Differential expression analysis identifies genes or transcripts that change systematically between conditions. This is one of the most common RNA-seq applications.
Most modern differential expression methods model read counts using statistical frameworks that account for biological variability. Many tools use negative binomial models because RNA-seq count data often show overdispersion relative to a simple Poisson model (Huang et al., 2015).
Common tools include DESeq2, edgeR, limma-voom, EBSeq, and related packages. The best tool depends on sample size, experimental design, count distribution, outliers, and whether the analysis focuses on genes or transcripts.
A 2022 evaluation of differential analysis methods found that method performance depends on sample size and data assumptions. The authors reported that DESeq2 performed slightly better than other methods in several simulated settings when sample size reached 6 or 12 per group (Li et al., 2022).
Researchers should report log2 fold change, adjusted p-value, effect direction, filtering criteria, statistical model, covariates, and the multiple-testing method. Fold change alone is not enough. Statistical significance alone is also not enough.
Step 16: Functional and Pathway Analysis
Differential expression lists need biological interpretation. Researchers often perform Gene Ontology enrichment, KEGG pathway analysis, Reactome analysis, gene set enrichment analysis, transcription factor target analysis, or network analysis.
These methods help identify biological themes. For example, a treatment may activate inflammatory genes, suppress cell-cycle genes, or shift metabolic pathways.
However, functional analysis depends on the gene universe, annotation quality, database choice, and statistical method. Researchers should define the background gene set carefully. Using all genome genes as background can bias results if the RNA-seq assay only detected a subset of genes.
RNA-seq analysis reviews describe functional enrichment and gene set analysis as common downstream steps after differential expression testing, but they also emphasize that pipeline choices can influence interpretation (Chen et al., 2023).
Step 17: Alternative Splicing and Isoform Analysis
RNA-seq can detect changes beyond total gene expression. A gene may produce the same total RNA level but change isoform usage.
Alternative splicing analysis can detect exon skipping, intron retention, alternative 5′ or 3′ splice sites, mutually exclusive exons, and differential transcript usage. These changes can affect protein domains, untranslated regions, localization, RNA stability, or translation.
Isoform analysis benefits from paired-end reads, longer reads, strand-specific libraries, and high-quality annotations. Short-read RNA-seq can infer isoforms, but it cannot always resolve full-length transcript structures. Long-read RNA sequencing can improve isoform discovery because it can sequence longer or full-length RNA molecules (Conesa et al., 2016).
Step 18: RNA-Protein Interactions and Specialized RNA-Seq Methods
Researchers can adapt sequencing to study more than expression. RNA immunoprecipitation sequencing, CLIP-seq, eCLIP, and related methods identify RNAs bound by specific proteins.
In these workflows, researchers capture an RNA-binding protein and sequence associated RNA fragments. Crosslinking can preserve RNA-protein contacts. Some CLIP-based methods can identify binding sites at near-nucleotide resolution.
RNA-seq principles also support massively parallel reporter assays. Researchers link regulatory sequence variants to barcoded transcripts. Sequencing barcode abundance then estimates regulatory activity across thousands of constructs.
These specialized methods extend RNA-seq from expression profiling to regulatory mechanism discovery.
Step 19: Single-Cell RNA-Seq
Single-cell RNA sequencing, or scRNA-seq, measures transcriptomes at the level of individual cells. It helps researchers identify cell types, cell states, developmental trajectories, immune populations, and tumor heterogeneity.
Bulk RNA-seq averages expression across a cell population. This can hide rare cell types or opposing expression programs. scRNA-seq solves this by profiling many cells separately.
Single-cell data require specialized QC, normalization, dimensionality reduction, clustering, batch correction, cell-type annotation, and differential expression workflows. QC often uses metrics such as detected genes per cell and mitochondrial read fraction. A 2021 scRNA-seq QC method paper notes that poor-quality cells often show high mitochondrial gene fractions and low numbers of detected genes (Hippen et al., 2021).
scRNA-seq adds power, but it also adds noise. Dropouts, doublets, dissociation bias, ambient RNA, and batch effects require careful handling.
Step 20: Reproducibility and Reporting
RNA-seq studies should support reproducibility. Researchers should report sample metadata, extraction methods, RNA quality metrics, library preparation kits, enrichment strategy, read layout, read length, sequencing depth, reference genome version, annotation version, software tools, parameters, filtering rules, normalization method, and statistical model.
They should also deposit raw data and processed count matrices when ethical and legal rules allow. Public repositories such as GEO, SRA, ArrayExpress, and controlled-access clinical repositories support reuse and validation.
A standardized pipeline improves transparency. NASA GeneLab’s RNA-seq consensus pipeline, for example, includes quality control, trimming, mapping, quantification, and differential expression to promote reproducibility and reuse (Overbey et al., 2021).
Common RNA-Seq Pitfalls
Low-Quality RNA
Poor RNA quality can distort expression profiles. Researchers should use suitable RNA integrity metrics and choose library methods that match sample quality.
Inadequate Replication
Low replicate numbers reduce power and weaken dispersion estimates. This increases false positives and false negatives.
Batch Effects
Extraction date, library batch, technician, sequencing lane, and instrument can introduce structure unrelated to biology. Randomization and covariate modeling help reduce this risk.
Wrong Enrichment Strategy
Poly-A selection can miss non-polyadenylated RNA. rRNA depletion can increase intronic and intergenic reads. Researchers must align the method with the question.
Annotation Mismatch
Different genome builds and annotation releases can change gene counts, transcript models, and differential expression results.
Overinterpretation
RNA abundance does not always equal protein abundance or biological activity. Researchers should validate key findings with independent methods.
Applications of RNA-Seq
Differential Gene Expression
Researchers use RNA-seq to compare gene expression between conditions. This is common in disease research, toxicology, drug response, developmental biology, and functional genomics.
Novel Transcript Discovery
RNA-seq can reveal unannotated transcripts, alternative promoters, novel exons, and new splice junctions. This is valuable in non-model organisms and poorly annotated genomes.
Cancer Transcriptomics
Cancer researchers use RNA-seq to study subtype markers, immune signatures, fusion genes, pathway activation, and resistance mechanisms.
Host-Pathogen Studies
RNA-seq can profile host and pathogen transcripts in the same experiment. Multi-species RNA-seq requires special alignment and quantification strategies because reads may derive from more than one organism (Chung et al., 2021).
Non-Model Organisms
RNA-seq can work in species without complete reference genomes. Researchers can assemble transcriptomes de novo and compare expression patterns using orthology or functional annotation.
Regulatory Biology
Reporter assays, RNA-protein interaction studies, and perturbation experiments use sequencing to connect regulatory sequence, RNA binding, and gene expression output.
Future Directions
RNA-seq continues to evolve. Long-read transcriptomics improves isoform resolution. Single-cell and spatial transcriptomics reveal cellular context. Multi-omics methods connect RNA abundance with chromatin state, protein abundance, genotype, and phenotype.
Clinical RNA-seq also continues to mature. A 2024 multi-center benchmarking study using reference materials found that experimental factors such as mRNA enrichment and strandedness, along with bioinformatics choices, contribute to inter-laboratory variation in detecting subtle expression differences (Wang et al., 2024).
Future RNA-seq research will likely focus on better standards, stronger benchmarking, more accurate isoform quantification, improved degraded-sample protocols, and integrated interpretation across molecular layers.
FAQ: RNA-Seq
What does RNA-seq measure?
RNA-seq measures RNA molecules in a sample. It can estimate gene expression, transcript abundance, isoform usage, and, in some workflows, novel transcripts or RNA-protein interactions.
Does RNA-seq require a reference genome?
No. RNA-seq works best with a high-quality reference genome and annotation, but researchers can use de novo transcriptome assembly when no reference genome exists (Conesa et al., 2016).
What is the difference between RNA-seq and qPCR?
qPCR measures selected targets. RNA-seq measures many transcripts at once and can discover unannotated transcripts. Researchers often use qPCR to validate selected RNA-seq findings.
What is the difference between bulk RNA-seq and single-cell RNA-seq?
Bulk RNA-seq measures average expression across many cells. Single-cell RNA-seq measures expression in individual cells and can reveal cellular heterogeneity.
Is RNA-seq quantitative?
RNA-seq is quantitative when designed and analyzed properly. However, technical biases, RNA quality, library preparation, sequencing depth, and normalization choices affect accuracy.
Conclusion
RNA-seq is one of the most powerful methods for studying gene expression and transcriptome biology. It can quantify known genes, reveal novel transcripts, detect isoform changes, support differential expression analysis, and connect molecular activity with biological function.
A successful RNA-seq experiment requires more than sequencing. Researchers must design the study carefully, preserve RNA quality, choose the right enrichment method, prepare libraries consistently, sequence at suitable depth, apply rigorous quality control, and use statistical models that match the data.
For researchers, RNA-seq offers both breadth and depth. It can profile complete transcriptional programs, uncover regulatory changes, and generate hypotheses for mechanistic validation. As single-cell, spatial, long-read, and clinical transcriptomics continue to mature, RNA-seq will remain central to modern genomics and molecular biology.
References
Baldwin, A., et al. (2021). An easy, cost-effective, and scalable method to deplete human ribosomal RNA for RNA-seq. Current Protocols.
Chen, J. W., et al. (2023). The hitchhikers’ guide to RNA sequencing and functional analysis. Briefings in Bioinformatics.
Chung, M., et al. (2021). Best practices on the differential expression analysis of multi-species RNA-seq. Genome Biology.
Conesa, A., Madrigal, P., Tarazona, S., et al. (2016). A survey of best practices for RNA-seq data analysis. Genome Biology, 17, 13.
Dobin, A., Davis, C. A., Schlesinger, F., et al. (2013). STAR: ultrafast universal RNA-seq aligner. Bioinformatics, 29(1), 15–21.
Hippen, A. A., et al. (2021). miQC: An adaptive probabilistic framework for quality control of single-cell RNA-sequencing data. PLoS Computational Biology.
Huang, H. C., Niu, Y., & Qin, L. X. (2015). Differential expression analysis for RNA-seq: An overview of statistical methods and computational software. Cancer Informatics.
Jaksik, R., et al. (2021). RNA-seq library preparation for comprehensive transcriptome analysis in cancer cells: The impact of insert size. Genomics.
Li, D., et al. (2022). An evaluation of RNA-seq differential analysis methods. PLoS ONE.
expression profiling and related recommendations. Scientific Reports.
Schroeder, A., Mueller, O., Stocker, S., et al. (2006). The RIN: an RNA integrity number for assigning integrity values to RNA measurements. BMC Molecular Biology, 7, 3.
Song, K., et al. (2023). RNA-seq RNAaccess identified as the preferred method for gene expression analysis of low quality FFPE samples. PLoS ONE.
Wang, D., et al. (2024). A real-world multi-center RNA-seq benchmarking study using the Quartet and MAQC reference materials. Nature Communications.
Wang, L., et al. (2009). RNA-seq: a revolutionary tool for transcriptomics. Nature Reviews Genetics.
Wang, L., et al. (2016). Measure transcript integrity using RNA-seq data. BMC Bioinformatics.