Cryo-electron microscopy (Cryo-EM) has fundamentally transformed our understanding of the molecular machinery that governs life. For decades, structural biology was often limited by the “crystallization bottleneck” of X-ray diffraction. Cryo-EM changed the paradigm, allowing scientists to peer into the microscopic world with unprecedented clarity and detail.
With its origins rooted in the pioneering work of Nobel laureates Jacques Dubochet, Joachim Frank, and Richard Henderson, Cryo-EM has evolved from a niche specialty—once jokingly referred to as “blobology”—into a mainstream powerhouse. Today, it is capable of revealing the hidden structures of proteins, viruses, and cellular components at atomic resolution.
What is Cryo-EM?
Cryo-EM is an umbrella term for a collection of advanced imaging techniques used to elucidate the three-dimensional (3D) structure of biological molecules and complexes in their native, hydrated state.
In this technique, the sample is rapidly frozen to temperatures below -150 °C, trapping it in vitreous ice. By imaging these frozen samples from different angles using a transmission electron microscope (cryo-TEM), researchers capture “snapshots” of molecules as they exist in solution. Advanced computational algorithms then digitally recombine these 2D snapshots into a high-fidelity 3D reconstruction.
The Core Principle: Vitrification
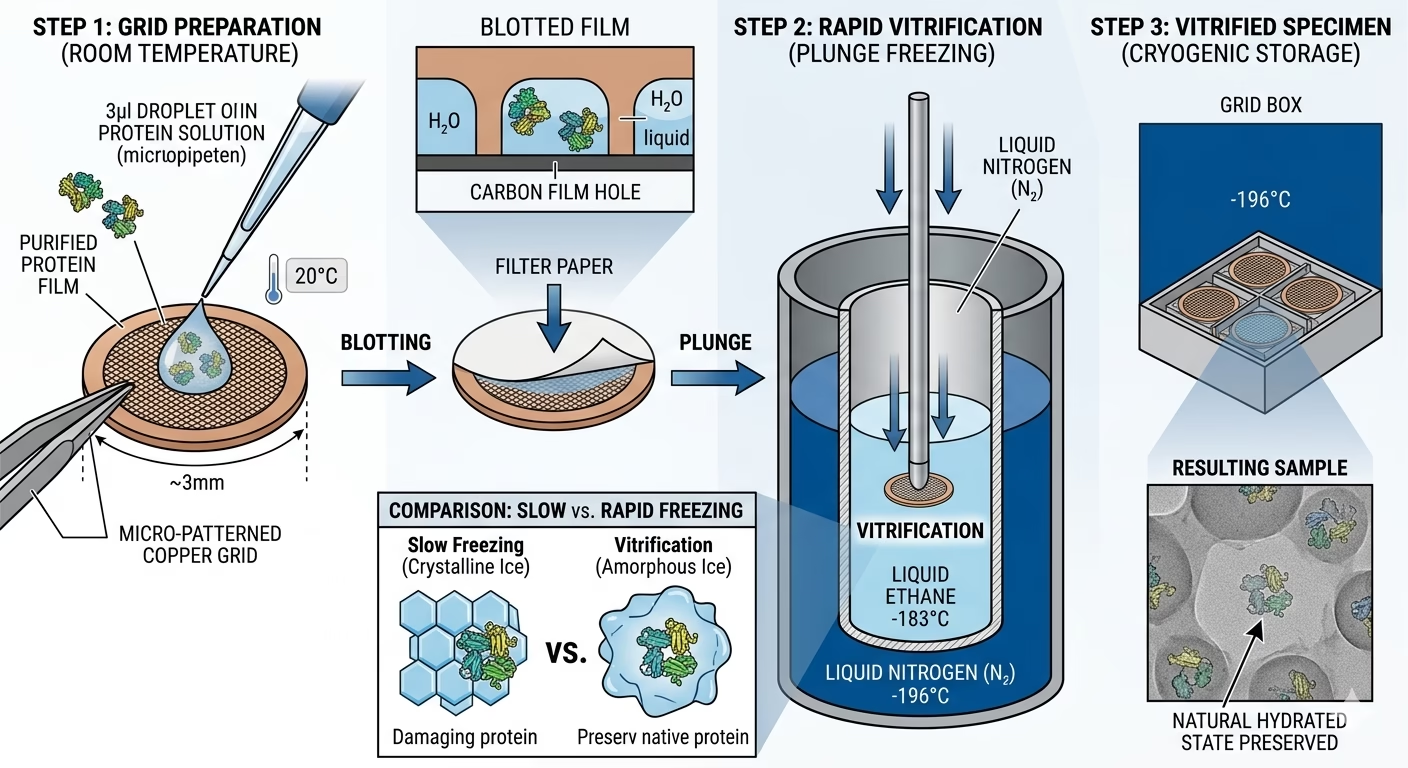
The biological relevance of Cryo-EM hinges on Vitrification. In conventional electron microscopy, cooling water usually leads to the formation of crystalline ice, which expands and destroys delicate protein structures. Furthermore, crystalline ice causes strong electron diffraction that dramatically reduces resolution.
Vitrification involves flash-freezing the aqueous solution so quickly (within milliseconds) that the water molecules do not have time to crystallize. Instead, they form a vitreous solid—a glass-like state that is transparent to electrons. This process provides a unique advantage: it preserves the specimen in its near-native state, providing physiologically relevant observations that techniques requiring harsh chemical treatments, staining, or dehydration cannot match.
Historical Development and the Nobel Path
The development of Cryo-EM was a direct response to the limitations of conventional EM, specifically sample destruction caused by high-energy electron beams and artifacts derived from chemical fixation.
1970s: Richard Henderson and Nigel Unwin produced the first 3D structure of a biological specimen (bacteriorhodopsin) using EM.
1980s: Jacques Dubochet developed the methodology for vitrifying water, allowing biological samples to be prepared for vacuum conditions without losing their structure.
1990s: Joachim Frank developed the computational strategies to process 2D images of randomly oriented particles into 3D structures.
2013–Present: The “Resolution Revolution” began with the development of Direct Electron Detectors and improved software, leading to the 2017 Nobel Prize in Chemistry.
Comparison: Conventional EM vs. Cryo-EM
| Feature | Conventional EM | Cryo-EM |
| Sample Prep | Fixation, staining, dehydration | Vitrification (Flash-freezing) |
| Integrity | High risk of artifacts | Native structure preserved |
| Resolution | Nanometer (nm) | Near-atomic (Å) |
| Sample Amount | Larger amounts required | Minimal (µg/mL) |
The Three Pillars of Cryo-EM Techniques
Cryo-EM is not a single method but a suite of analytical tools tailored to the nature of the sample.
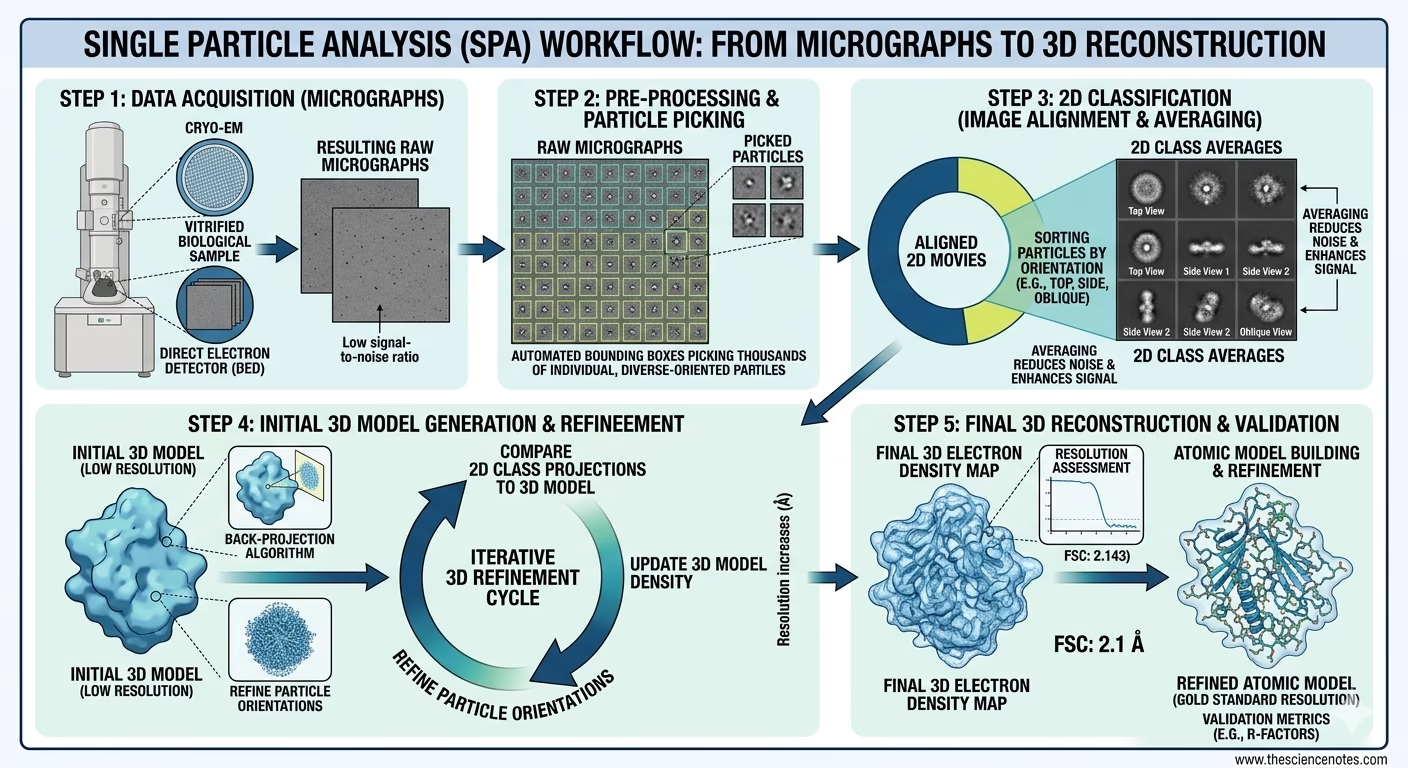
1. Single Particle Analysis (SPA)
The most popular Cryo-EM technique and the primary alternative to X-ray crystallography.
The Process: Purified proteins are vitrified, resulting in thousands of molecules oriented randomly within the ice.
The Goal: The TEM collects 2D snapshots of every possible orientation. These are then digitally aligned, classified, and averaged into a 3D reconstruction.
Key Achievement: SPA has recently resolved structures like the human GABA-A receptor at 1.7 Å, revealing binding pockets for small molecules like histamine.
2. Cryo-Electron Tomography (Cryo-ET)
While SPA looks at “purified parts,” Cryo-ET looks at the “whole machine” inside the cell.
The Process: Used for whole cells or tissues. Since cells are thick, researchers use Focused Ion Beam (FIB) milling to shave away layers, creating a thin “window” or lamella.
The Goal: The sample is tilted at various angles ($+/- 60) to take a series of 2D images (a tomographic tilt series) that are reconstructed into a 3D dataset called a tomogram.
3. Microcrystal Electron Diffraction (MicroED)
MicroED is the “bridge” between crystallography and EM.
The Process: It utilizes electron diffraction rather than imaging.
The Advantage: Electrons interact with matter 10^4 to 10^6 times more strongly than X-rays. This allows atomic details to be extracted from nanocrystals (<200 nm) that are too small for traditional X-ray diffraction.
How Cryo-EM Works: The Technical Workflow
The modern Cryo-EM workflow has evolved from a manual, labor-intensive process into an increasingly automated pipeline. The transition from a purified sample to a high-resolution 3D density map involves four critical stages:
1. Sample Preparation and Grid Loading
The process begins with a purified macromolecule suspended in an optimized aqueous buffer. A tiny volume (typically 3–5 microliters) is applied to a specialized EM grid—usually a 3mm copper mesh coated with a thin, holey carbon or gold film.
Critical Factor: The concentration must be precisely tuned to ensure that particles are densely packed within the grid holes but do not overlap, which would complicate the later stages of particle picking.
2. Vitrification: The Art of Flash-Freezing
The grid is mechanically “blotted” with filter paper to remove excess liquid, leaving a thin film of water only a few hundred nanometers thick. The grid is then rapidly plunged into a primary coolant, typically liquid ethane (maintained at approx. -183°C).
The Goal: To achieve a “vitreous” (glass-like) state of water. This prevents the formation of ice crystals that would physically damage the protein or obscure the image with strong diffraction patterns.
3. High-Resolution Data Acquisition (Imaging)
The vitrified grids are transferred into the high-vacuum environment of a Cryo-TEM (Transmission Electron Microscope) or Cryo-SEM (Scanning Electron Microscope).
Cryo-TEM: The electron beam passes through the sample to reveal internal atomic structures. This is the primary tool for Single Particle Analysis.
Direct Electron Detectors (DEDs): Modern microscopes use CMOS-based DEDs that act like high-speed cameras, capturing “movies” rather than static images. This allows the software to track and correct for the movement of the sample during the exposure.
4. Computational Image Processing
Once terabytes of raw “movies” are collected, they undergo rigorous digital analysis:
Motion Correction: The software aligns individual movie frames to fix “beam-induced motion”—the slight movement caused when electrons strike the frozen sample.
CTF Estimation: Calculating the Contrast Transfer Function to correct for lens aberrations and defocus, ensuring the final map is sharp and accurate.
Particle Picking: Automated algorithms (often powered by Deep Learning/AI) identify and extract hundreds of thousands of individual protein projections from the micrographs.
2D Classification: These projections are sorted into groups based on their orientation. “Bad” particles (damaged proteins or contaminants) are discarded here.
3D Refinement: Through iterative back-projection algorithms, the 2D classes are merged into a 3D density map. This map is refined until the resolution allows for the building of an atomic model.
Mathematics in Data Analysis
To achieve atomic resolution, Cryo-EM relies on complex signal processing to overcome low contrast.
The Contrast Transfer Function (CTF)
The microscope optics introduce phase shifts described by the CTF:
CTF(k) = A(k) sin [ π Δz λ k² + ½ π Cs λ³ k⁴ ]
Where:
Δz is the defocus
λ is the electron wavelength
Cs is the spherical aberration
Fourier Shell Correlation (FSC)
The quality of a 3D map is determined by the FSC. The data is split into two independent halves; the resolution is defined at the point (typically the 0.143 threshold) where the correlation between the two maps drops significantly.
Strengths, Limitations, and Comparisons
Cryo-EM serves as a powerful, complementary technique to other structural biology methods such as Nuclear Magnetic Resonance (NMR) and X-ray Crystallography.
Strengths
No Crystallization Required: Eliminates the single biggest bottleneck in structural biology, particularly for large complexes and membrane proteins.
Visualizes Large, Flexible Complexes: Excels at resolving massive molecular machines (like ribosomes) that are too complex for NMR.
Captures Conformational Heterogeneity: Unlike the static “average” of a crystal, Cryo-EM can capture a protein “in motion,” showing multiple functional states in a single sample.
Limitations
The Small Protein Barrier: Molecules smaller than < 50 kDa are currently difficult to image and align due to their low signal-to-noise ratio.
High Financial Barrier: A top-tier setup represents a significant investment, with equipment costs ranging from $5 to $7 million USD, plus high annual maintenance.
Massive Data Demand: A single session can generate several terabytes of raw data, necessitating robust GPU-based computational clusters for processing and storage.
Applications of Cryo-EM
Structural Biology: Understanding protein functions and mechanisms of membrane proteins (GPCRs).
Virology: Aiding vaccine development by visualizing viral capsids and spike proteins (e.g., SARS-CoV-2).
Drug Discovery: Rational drug design for ion channels and large macromolecular assemblies.
Neurobiology: Studying synaptic vesicles and protein aggregates in neurodegenerative diseases like Alzheimer’s.
Biochemistry: Mapping the machinery of DNA replication, transcription, and translation.
Conclusion
Cryo-electron microscopy has moved from a specialty tool to a transformative technology. By enabling the visualization of biological samples in their near-native state and at high resolution, it provides unprecedented insights into the structures and functions of life’s diverse biomolecular systems. Whether through Single Particle Analysis, Cryo-Tomography, or MicroED, it allows us to analyze proteins in all their complex, heterogeneous glory.
X-ray Crystallography: Definition, Principle, Steps, Data Analysis, Applications, and Limitations